During our School BOE’s last goal setting initiative, BOE members determined to survey our school community. The primary goal was to determine what is the perception of our school community–school personnel, students and parents–in regard to our climate for learning. We received the results of the survey, done in each of our buildings, yesterday and while the full report is 143 pages per building, I’m sharing the summary reports here, in our school newsletter and of course, with our BOE members.
According to the National School Climate Center we had a strong return rate in both buildings. In our 7-12 building we had 76.94% of our students, 58.72% of our school personnel, and 23.25% of our parents participate. In our elementary school, our 3-6 population participated with 87.80% of our students, 48.86% of our school personnel and 27.38% of our parents. If you double click on any of the photos below, you will be able to see them enlarged.
Here is an explanation of the school climate survey 
and the 12 indicators examined.  Our 7-12 building had the following overall results:
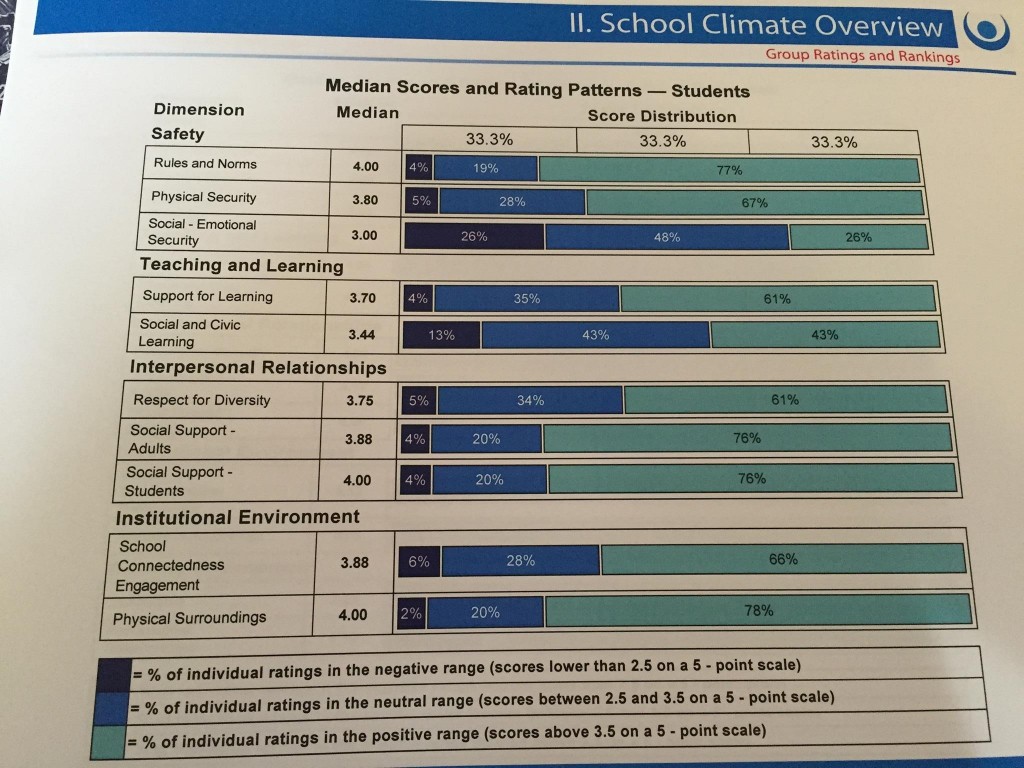

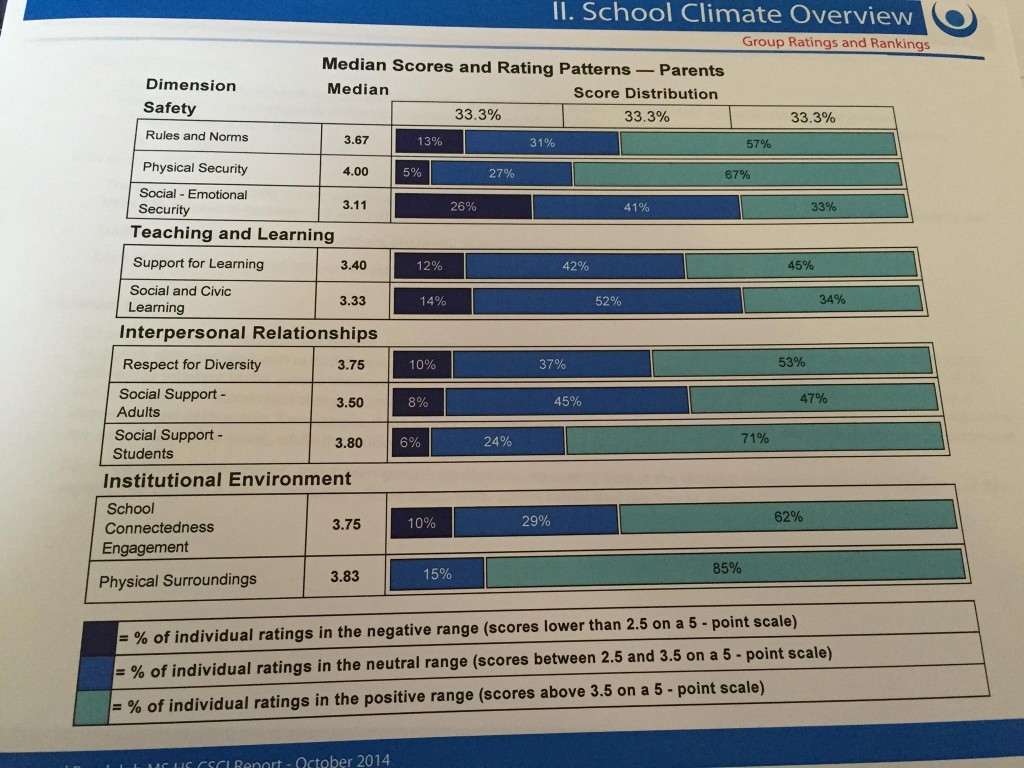
And Gail N. Chapman posted these survey results:
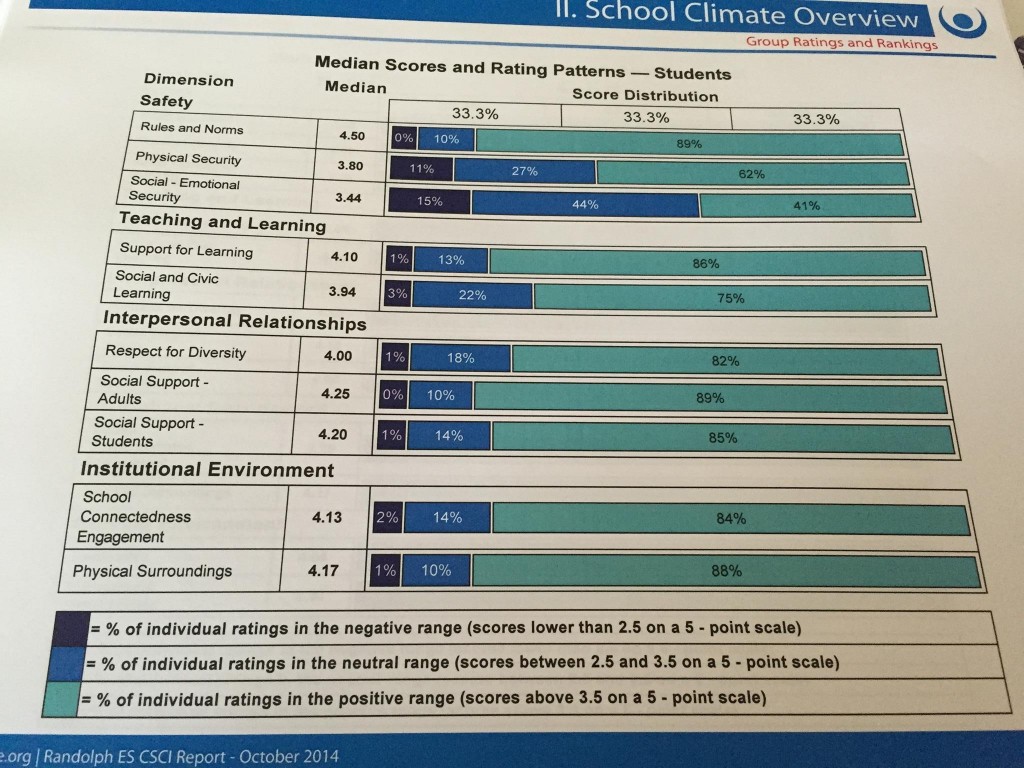
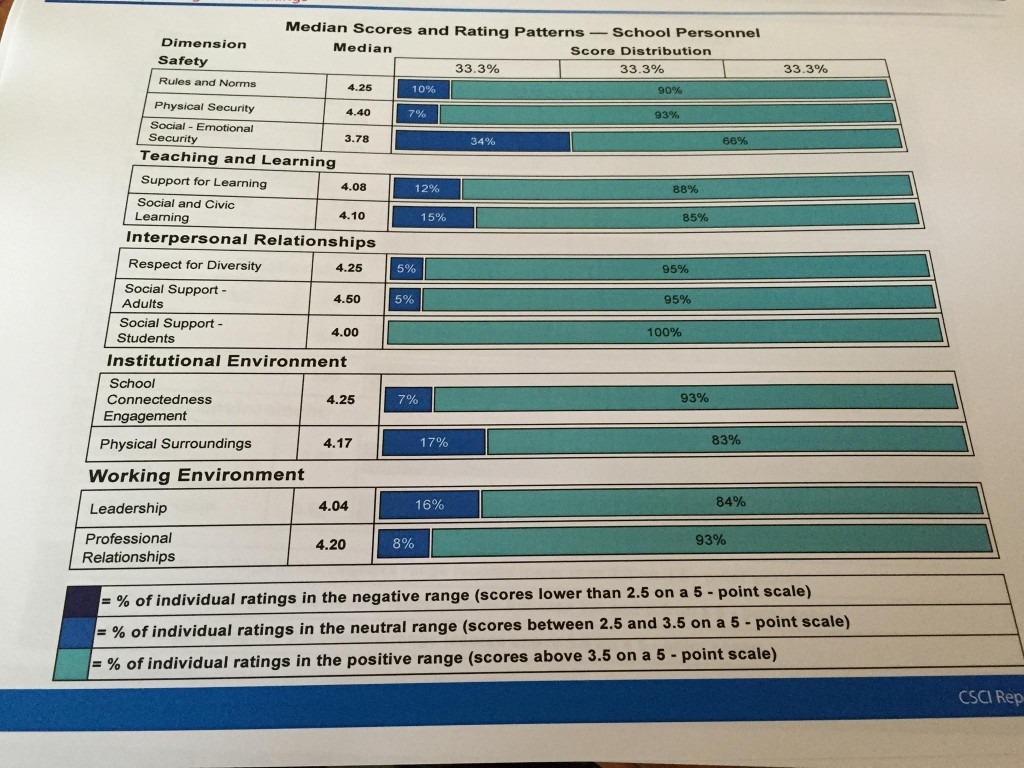

The BOE members and administrative teams will be studying the detail of the results. As you can see from the charts in this post–the overall results are very favorable. Thank you to everyone who participated!
I recently was informed by a parent in my community that our principal sent out an email regarding a climate survey that we are doing. Unfortunately, the information that he included, as his own writing, was lifted directly from this article.